


How to Build a Light/Dark Mode Theme Switch in Power BI 🌓 (No DAX, With Accessibility in Mind)
- What We're Building
- Step-By-Step: Build The Power BI Dark Mode Switch
- Step 1: Create Your Theme Switch Table
- Step 2: Add Your Colors (Hex Codes)
- Step 3: Add a Slicer
- Step 4: Apply Dynamic Colors (Conditional Formatting)
- Step 5: Speed Run Formatting
- Optional: Build a Cute Toggle Button (Coming Up When the Stars Align).
- Quick Dark Mode Accessibility Checklist For Power BI
- Closing Vibes
- About The Author
Contents
- What We're Building
- Step-By-Step: Build The Power BI Dark Mode Switch
- Step 1: Create Your Theme Switch Table
- Step 2: Add Your Colors (Hex Codes)
- Step 3: Add a Slicer
- Step 4: Apply Dynamic Colors (Conditional Formatting)
- Step 5: Speed Run Formatting
- Optional: Build a Cute Toggle Button (Coming Up When the Stars Align).
- Quick Dark Mode Accessibility Checklist For Power BI
- Closing Vibes
- About The Author
How to Build a Light/Dark Mode Theme Switch in Power BI 🌓 (No DAX, With Accessibility in Mind)
Alright, dark-mode fans, this one’s for you!
We learned in the last post that while dark UI feels sleek, it’s not automatically accessible and it shouldn’t be your default strategy (hello, contrast + glare). In most cases, light mode is the more accessible baseline (just imagine trying to work on a sunny beach or on your balcony with dark mode… nightmare).
But UX is also about choice. Some users love light, some swear by dark. So let’s give them control.
Let’s build a Light/Dark Mode switch in Power BI without DAX, without fancy scripts, and without crying. AND we’ll do it responsibly, with accessibility checks baked in.
We’re going with user-controlled dynamic styling, using Field value formatting and a tiny Theme Switch Table (this can be expanded later as much as you want).
What We're Building
- A Theme Switch table with two rows for the Mode: Light and Dark
- Columns hold your design tokens (Background, Text, Accent, etc.)
Design Token Moment 💡 In proper UI/UX design systems (think Google Material, Adobe, etc.), colors, spacing, and typography values are stored as tokens—named values that act as a single source of truth. You’re doing the exact same thing here in Power BI: naming values so you don’t manually reapply hex codes everywhere.
- A single-select slicer to choose mode
- Conditional formatting using fx → Format by → Field value
- No measures needed
💡 Accessibility Reminder # 1: When filling hex codes, test contrast immediately—don’t wait until the end.
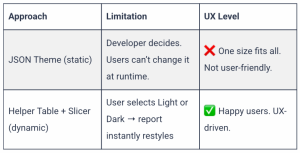
⚠️ Before You Get Too Excited: Know the Limitations
- This works only for properties that support fx → Format by → Field value. Not all visuals in Power BI do.
- Background images, page-level wallpapers, and some old visuals won’t react to this method.
- Custom visuals behave inconsistently.
Advanced UX Note:
If you also want data-driven conditional formatting like Min/Max, Status colors, KPI heatmaps alongside the Light/Dark theme switch, that requires a hybrid approach using measures that check both the slicer and your logic.
👉 This tutorial keeps it clean with no DAX, but we can level it up in a follow-up.
Step-By-Step: Build The Power BI Dark Mode Switch
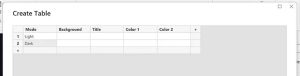
Step 1: Create Your Theme Switch Table
Enter Data → Call it ‘Theme Switcher’ or ‘UI Mode’
Add desired columns, e.g. Background, Text, Color 1, Color 2…
Step 2: Add Your Colors (Hex Codes)
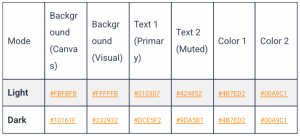
💡 Accessibility Reminder # 2: Avoid pure black backgrounds. Use deep gray (e.g., #1C2237) to reduce text glow.
Step 3: Add a Slicer
- Bind slicer to the Mode Column in your table
- Set to Single Select
- Sync slicer across report pages for global behavior
💡 Accessibility Reminder # 3: Make sure focus/hover states on the slicer are visible in both themes.
Step 4: Apply Dynamic Colors (Conditional Formatting)
On any visual → Title Color / Background Color / Lines etc → fx button → Format by: Field value → Based on field: pick your desired column
Because the slicer filters the table to a single row (Light or Dark), the colors update in real time. Magic. ✨
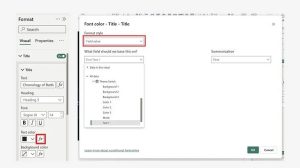
Example showing conditionally formatting the Title of a visual based on Field Value: Text 1 (hex code)
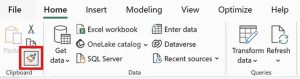
Step 5: Speed Run Formatting
Format one visual beautifully → Select the visual → Copy format (see screenshot below)→ Click on your next visual. Thank me later.
Optional: Build a Cute Toggle Button (Coming Up When the Stars Align).
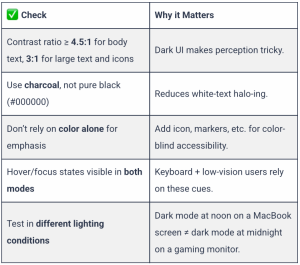
Quick Dark Mode Accessibility Checklist For Power BI
Before you unleash your dashboard on your team, run this:
👉 Get my full Accessibility Checklist ✅.
Closing Vibes
Voilà! A Light/Dark Mode switch in Power BI, no DAX sacrifice required, with proper UX responsibility baked in. Give your users control, but guide them safely through the galaxy of contrast and theme joy.
Happy designing! And may your hex values always pass contrast testing. 🚀
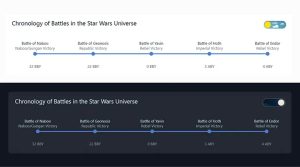
P.S. Yes, my demo uses Star Wars battle timelines. I had to organize my chaos. UX meets nerd joy. 🤓
About The Author

Microsoft MVP • Power BI meets UX/UI Design 📊 • Founder @ MoonStory 🌙 • Speaker • Design rebel bringing joy to data viz ✨

Drakulevska, E (04/02/2026) How to Build a Light/Dark Mode Theme Switch in Power BI 🌓 (No DAX, With Accessibility in Mind). ⚡ POWER BI DARK/LIGHT MODE SWITCH WITH A SLICER (NO DAX)
trending posts


